Ultimate Guide to Nonprofit Annual Report | Tips & Best Practices
Your annual report is just what it sounds like – a report on everything your nonprofit did for the previous year. It will include a look at major donations you received, your impact, any new programs or initiatives you launched, and any other progress or updates about your organization. If you're not sure how to get started, keep reading to learn some best practices for creating a perfect annual report!
Subscribe to our e-newsletter to receive the latest blogs, news, and more in your inbox.
Join the fundraising movement!
Subscribe to our e-newsletter to receive the latest blogs, news, and more in your inbox.
Writing your nonprofit annual report can be tricky. You want to make sure current donors really read it while also appealing to potential donors. You want to express gratitude and inspire action. Most importantly, you want to show off your year’s accomplishments.
Here are Donorbox’s tips on how to create an engaging annual report as well as some of our favorite examples of nonprofits who did it best.
Best Practices For Writing an Effective Nonprofit Annual Report
1. Use Visuals to Convey the Impact
Being design-driven when creating your nonprofit annual report is more important than ever. While it’s true that your nonprofit annual report contains information that’s valuable to your audience, the message can be easily lost if it’s not presented in the right way.
Convey the impact your nonprofit has had through pictures, photo galleries, infographics or a combination of the two. Avoid huge blocks of text (that may not be read!) and opt for more pictures and fewer words.
Graphs and charts can also be a great way to display vital data without boring the socks off your readers, and infographics can be a fun way to add a visual element to your content. Overall, pictures, infographics, and a mix of other aesthetic visual elements will keep your readers actively engaged with the content.
Refer to your branding guidelines! These will inform your nonprofit annual report design. If you don’t have them, start by (re)evaluating your brand persona, values, mission, and vision. Choose your color scheme carefully to match your brand and logo. Identify all of the elements that help tie these together and think about how you can display them visually. Then, develop a central theme that you can use and reference throughout your annual report. You may want to appoint a freelancer graphic designer for this work. There are plenty you’ll get with the experience.
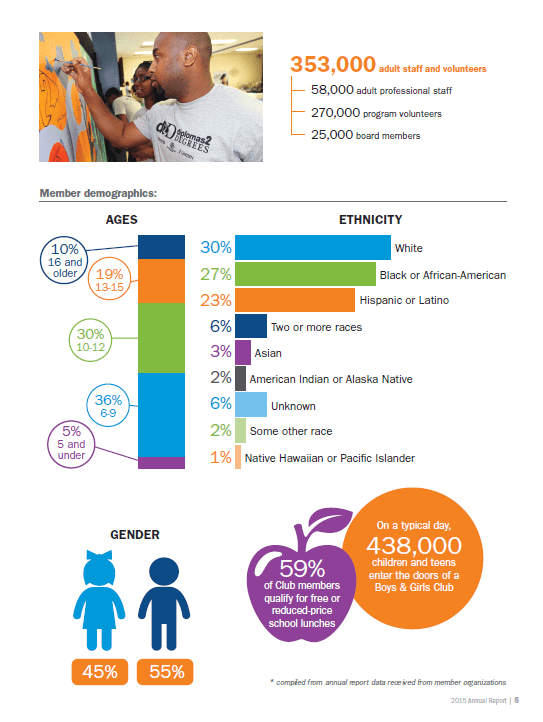
They use colorful and cute infographics to inform their readers about their meaningful impact!
In their annual report, Charity: Water – the masters of the visual – take an issue as complex as the global water crisis and turn it into powerful images that inspire change. They use bright colors and choose to share happy faces of their beneficiaries to inspire their supporters with a hopeful view of the global water crisis.
2. Humanize the Success by Sharing Individual Stories
Tell individuals’ stories in your annual report. Humanize the success that is the result of your fundraising and hard work. Select meaningful quotes and pictures that highlight the best of your nonprofit organization’s work.
Stories are more likely to stick in your supporters’ minds because telling a story helps associate emotions to events. Sharing statistics is very important and can indeed be more comprehensive, but it just doesn’t provoke the same emotional response. That makes it less likely to stick in people’s minds.
Look at the accomplishments you want to highlight, then find a human story for each one of them. It could be a story of a beneficiary whose life has changed as a result of your work or a story of an inspired volunteer.
When telling stories, share a story of one person rather than a group. Use one, named person as the subject of your story. It’s easier to connect to a single person than to a group!
Use the person’s own words as much as possible to tell the story. Quotes and first-person narratives are the most compelling.
Clearly show the change that resulted from your nonprofit’s action and the donors’ gifts. Use a storytelling structure with a beginning, middle, and end to show what changed as a result of your programs/activities.
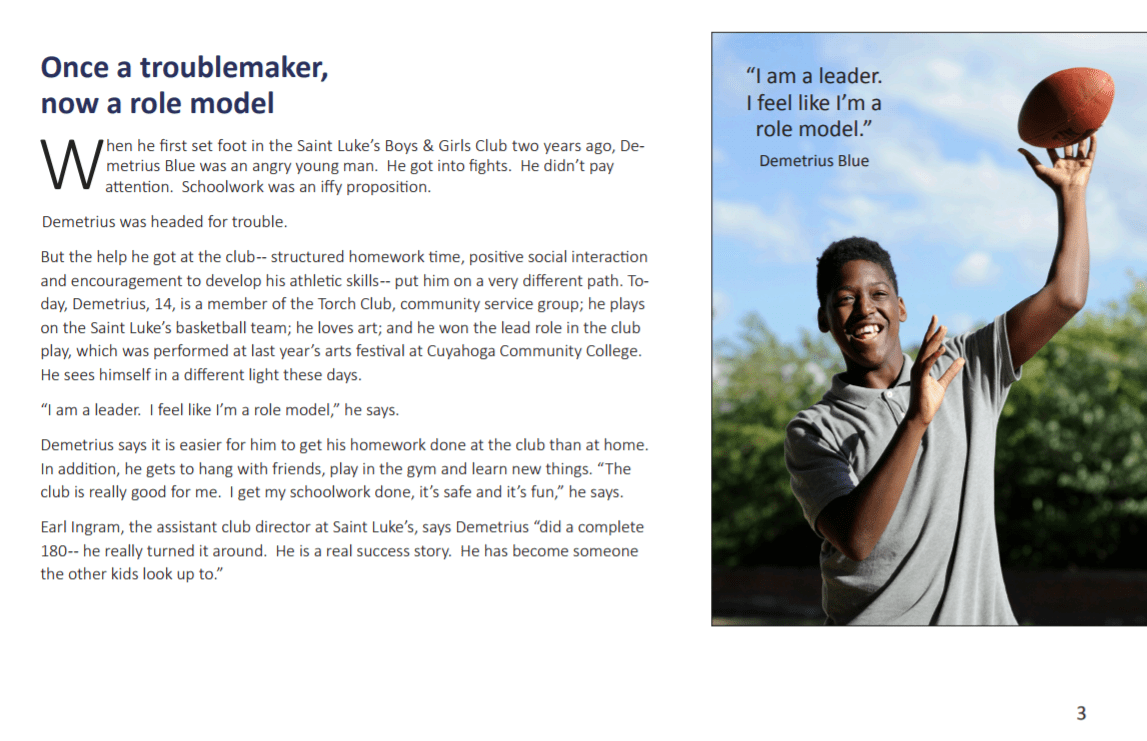
In their nonprofit annual report, they feature individual success stories of children that have benefitted from the Boys & Girls Clubs.
3. Be Transparent Regarding Your Financials & Operations
Be honest about your successes and the areas that you can (and will!) improve. Transparency is key in building and maintaining the trust of your donors and is a crucial aspect of any nonprofit’s annual report.
Also, clearly explain where your revenue comes from and how you spend it. In addition to the information provided in traditional financial statements, it’s helpful to include visuals like pie charts, bar graphs, or infographics to help readers see the big picture and understand financial trends. Make sure to explain the meaning behind all those numbers.
Providing transparent reporting demonstrates integrity and vulnerability. People want to work for, stand behind, and donate to an organization whose values they share and are inspired by.
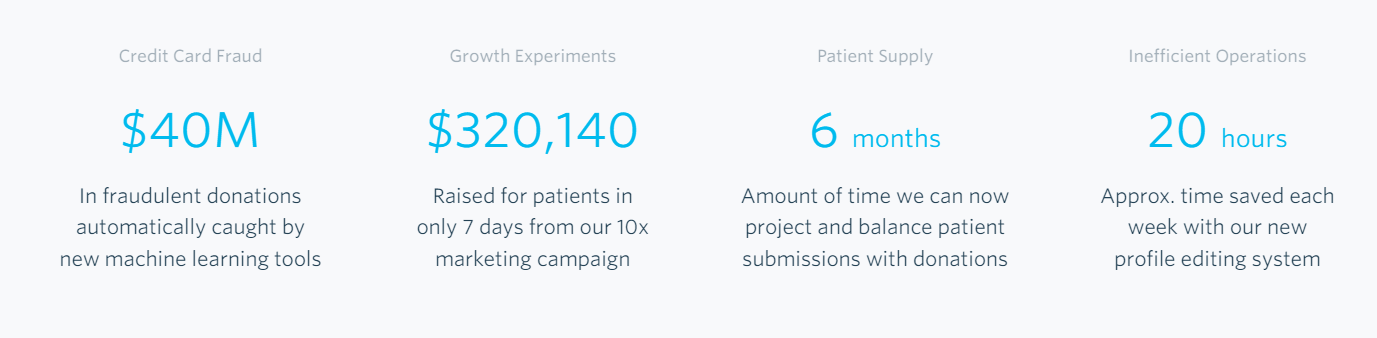
Watsi embraced transparency in its 2016 nonprofit annual report. They highlighted their biggest triumphs and pitfalls, including credit card fraud and inefficient operations, and showcased their attitudes of growth and positivity while doing so!
4. Be Specific on How Donations are used to Make an Impact
Be specific about how donations were used and the ways in which your nonprofit created a real impact. Your donors want to know how their money is helping! Use specific stories, campaigns, or events (while using visuals and making them personal!) to showcase the difference your nonprofit is making.
Offer details to your supporters. This makes your work tangible and motivates people to contribute to your work.
Use pictures and case studies to tell the story of your work. Use graphics like a project map or report to strengthen the connection between the donor and the real-world impact.
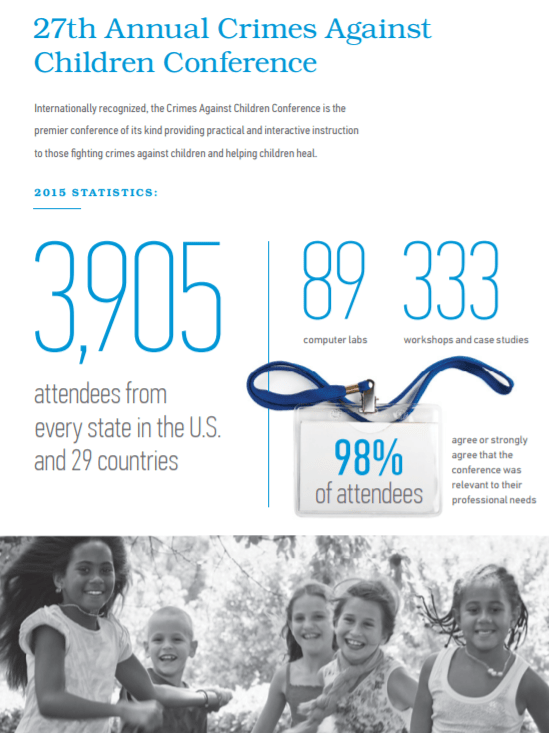
They use statistics to show exactly where funds are going- to computer labs and workshops and case studies in this case.
5. Convey Gratitude by Saying “Thank You”
Convey gratitude throughout the annual report. Some nonprofit annual reports dedicate pages to individuals and corporate donors. Whichever style you choose, be sure that your report exudes appreciation. You can use pictures and words from your board members to convey eye-catching thank-you messages throughout the report. When board members say it, naturally, the messages come alive and make a bigger impact.
Even if you don’t include a donor honor roll because you’ve decided it’s too resource-intensive, you can still acknowledge you’d have nothing to report on without donor support.
Sprinkle thank you’s throughout the body of your report copy. When you report on a program, conclude with “this was only possible with the support of our corporate partners, foundation friends, and individual supporters.”
Convey how important donor support is to your success. Do this through the stories you tell, the donor profiles and photos you include, and the overall tone. This attitude of gratitude should permeate the entire report.
Saying “thank you” creates a personal connection to your supporters that can boost engagement with fundraising campaigns and loyalty to your organization.
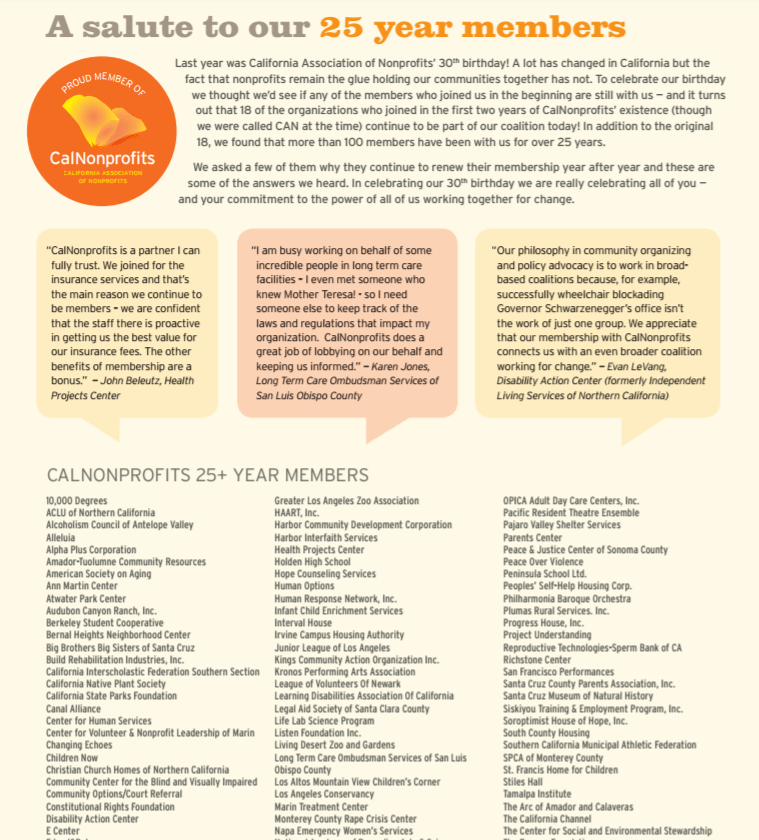
CalNonprofits show gratitude by giving special recognition and thanks to their 25-year members on a page of their annual report.
6. Inspire Your Readers to Take Action
Tell your readers how they can continue to support your organization. Be specific and include the various ways that readers can continue or begin to support your nonprofit. Talk about your needs and the most beneficial ways to help. Click here for more tips on how to create a compelling call to action.
Tell your readers exactly how they can help your organization. Include a small box or a full page at the end of the report (or a link or form online) with a call to action or request for help.
You may want to list the types of donations you can accept and the different ways in which your donors can support you. For example, do you accept in-kind donations?
What about planned giving or peer-to-peer fundraisers? How about your volunteering program or your workplace giving program? Mention both monetary and non-monetary ways people can support you. Also, include your social media accounts and links to your web pages where they can find out more about your day-to-day activities and ongoing programs. Social media links are also helpful in making a long-lasting connection.
Remember that your nonprofit annual report is the best opportunity to spread awareness about everything you’re doing.
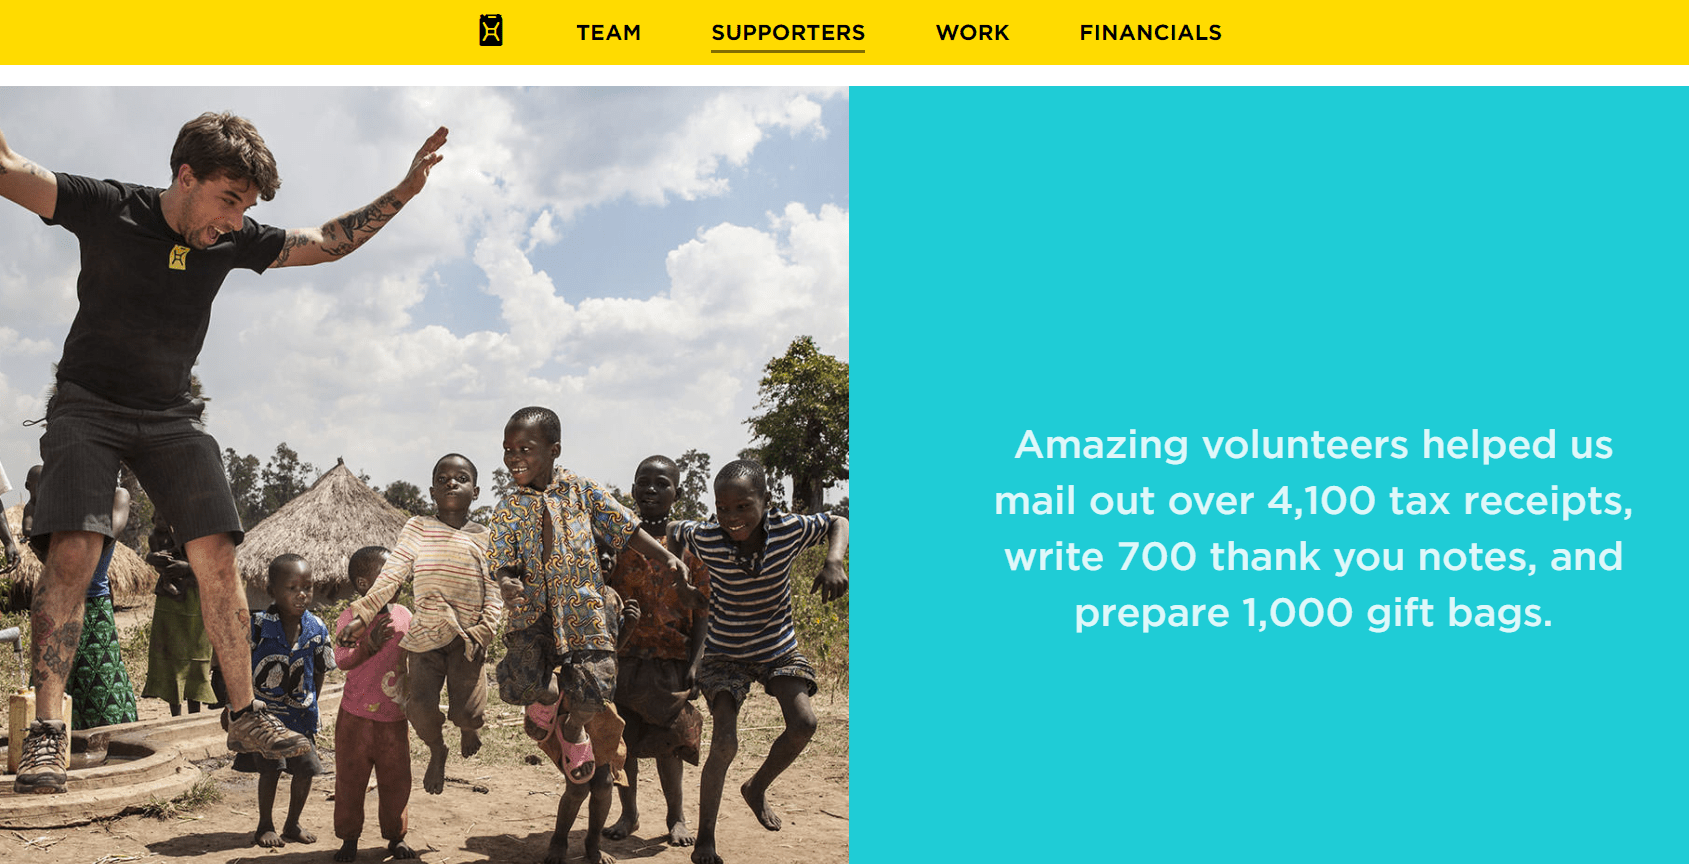
Charity: Water includes specific ways to help like writing thank-you notes and preparing gift bags.
7. Break Down Your Financials in a Comprehensible Format
Include the financials in easy-to-understand graphs and charts. You don’t need to go into extreme detail, but let your supports know where your revenue came from and where you spent that money.
Since an annual report isn’t really a legal or governmental document but a communications piece aimed towards donors – there’s no need to print your full financial statements in your annual report. Readers who are unfamiliar with financial statements will skip right over those big tables full of numbers.
Even people who know how to read them may not take the time to do so or draw meaning from them. Finally, full financials take up lots of space, and because annual reports can be expensive to design, print, and mail, every page counts.
Instead, use graphics and a short narrative description of how you raised and spent the money. The financial section of your annual report needs to tell a story too.
Include a note that says that your full financials are available upon request or on your website.
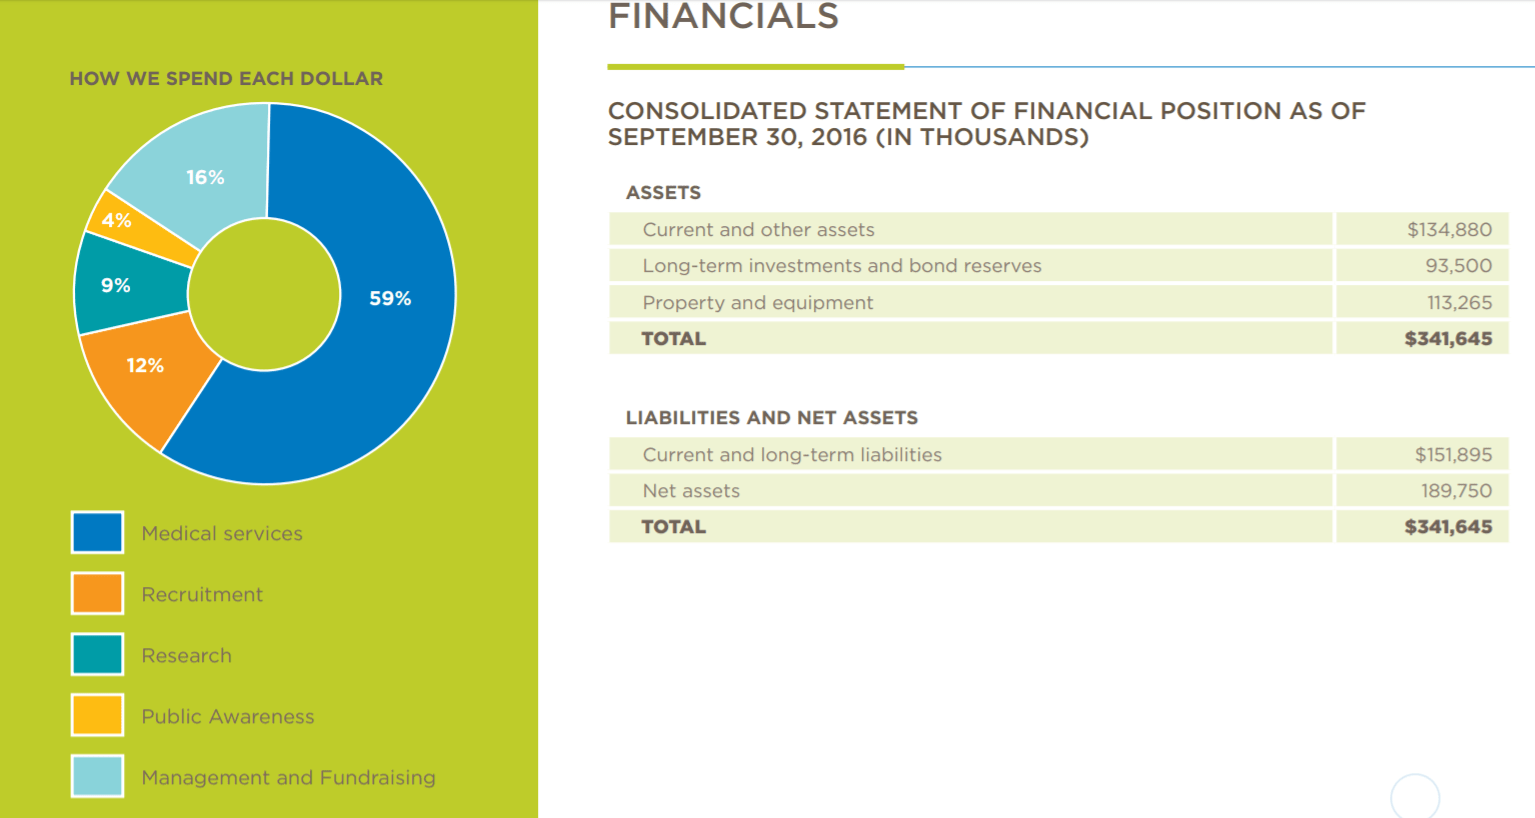
Be the Match breaks down their financials in a colorful and easy-to-comprehend infographic that shows exactly how they spend their money.
8. Include a Table of Content to Make Your Report More Readable
Readability matters. Your readers should know what to expect when reading your annual report.
Include a Table of Contents at the start of your report and give your readers the option to jump to the parts they need to refer to (or they’re most interested in).
A Table of Contents is important to orient the reader. It gives them a roadmap to your annual report. Furthermore, breaking up your report into manageable chunks (sections, parts) makes it easier to digest for readers. And having it neatly organized at the beginning makes it easier to navigate.
Additionally, annual reports can be quite information-heavy, with a great deal of technical information on each page. So, to prevent your readers from getting lost it’s important to create a clear hierarchy of information on each page by altering the size, weight, and placement of various elements. For example, headings should be larger than subheadings, key figures should be bolder than the general body text, etc.
They created a simple but clear and effective Table of Contents for their annual report. There’s lots of negative space, focusing the eye, and a powerful photograph accompanying the Table of Contents.
Some Bonus Tips For an Engaging Nonprofit Annual Report:
The cover of your annual report should grab and hold the attention of your readers. This can be hard to achieve without the help of a professional designer, so consider hiring one.
Consider including video if possible and if it adds value to your report without making it too bulky or complicated. Video can convey more information and in a more interactive and engaging way. Therefore, video can be an effective way to showcase results or share a wholesome message.
Create a dashboard for project-based fundraisers and share the link in your report so your donors can track your progress regularly on a live dashboard and feel included in the progress.
Clearly, you want your nonprofit to maintain a professional image. However, you can achieve professionalism without projecting a cold or impersonal corporate image. Therefore, cut out professional and field-specific jargon and spell out all acronyms the first time you use them.
2. Too Much Data
It is necessary to communicate overall earnings, expenses, and other data. But you should report this in as visual a manner as possible, and you shouldn’t let this data take over your report. Focus on combining statistics and reporting with stories and impact reports.
3. Too Much of ‘Me, Me, Me’
Apply a donor-centered attitude to your report’s content. This means you speak to your donors and their interests and you highlight how their support helped you accomplish your goals. Annual reports are usually written to address donors after all. While you’re at it, ditch speaking about fundraising achievements. These should not be celebrated in your annual report on the 5. same level as your mission-related results. Readers would rather know what you did with the money than how you raised it.
4. Too Much About Activities
Rather than listing off last year’s activities, talk about how those activities led to quantifiable results and meaningful achievements. Your readers want to know what their time and money did for the cause they care about. So, use this space to highlight how your donors have made a difference.
5. Too Much, Just Too Much
Many nonprofit professionals do not do enough thinking about the relevance of their annual report narrative. Indeed, one of the most difficult decisions that arise in annual report production is what to leave out. There’s rarely a shortage of material. Much of it, however, is of questionable value to the reader. Too much narrative makes it difficult for the reader to read and understand the report. Share only what’s relevant and of interest to your audience. For that, know your audience and always ask yourself: “So what?” before including something in the report.
Charles Z is the Founder and CEO of Donorbox. He has been starting companies and numerous web applications since college. Nowadays he is immersed and wildly excited about the future of the social impact sector.
 Join the fundraising movement!