Sometimes planning a Giving Season campaign feels like a guessing game. Sure, maybe you have last year’s campaign data to guide you, but often we make choices that are less-than-informed.
That’s where these statistics come in. I’ve hand-picked 7 stats to illuminate the state of fundraising as we head into Giving Season. I’ll share what we learned from 2025’s Giving Season, what we can learn from general 2025 giving statistics, and how we can use both to inform smarter strategies this year.
Choose a donation form that offers more payment methods, including digital wallets.
7 Giving Season Statistics for Smarter Planning
1. In 2025, nonprofits brought in 37% of all online revenue in December.
We all know that December is when giving really amps up. Many people who celebrate holidays in December donate to honor the spirit of giving common during this season.
For tax-savvy donors, December is also the last time to give before the end of the tax year. Once wealthy donors understand their income and liabilities for the year, they may benefit from giving more to charity before January 1st. This could be why December 31st accounted for 4% of annual revenue.
What to do
If Giving Season fundraising isn’t already a huge priority for your organization, it needs to be.
Almost 40% of all online giving is coming through those last 31 days of the year. Get your nonprofit front and center so donors who are considering year-end gifts have you top of mind.
Start early – like, October early – and focus on sharing stories of impact to showcase how your organization has made a difference this year.
To capture attention from donors concerned about tax incentives, share clear messaging and reminders about the looming end-of-tax-year deadline. You can also share that, thanks to the OBBB Act, donors who take the standard deduction are now eligible for higher tax incentives
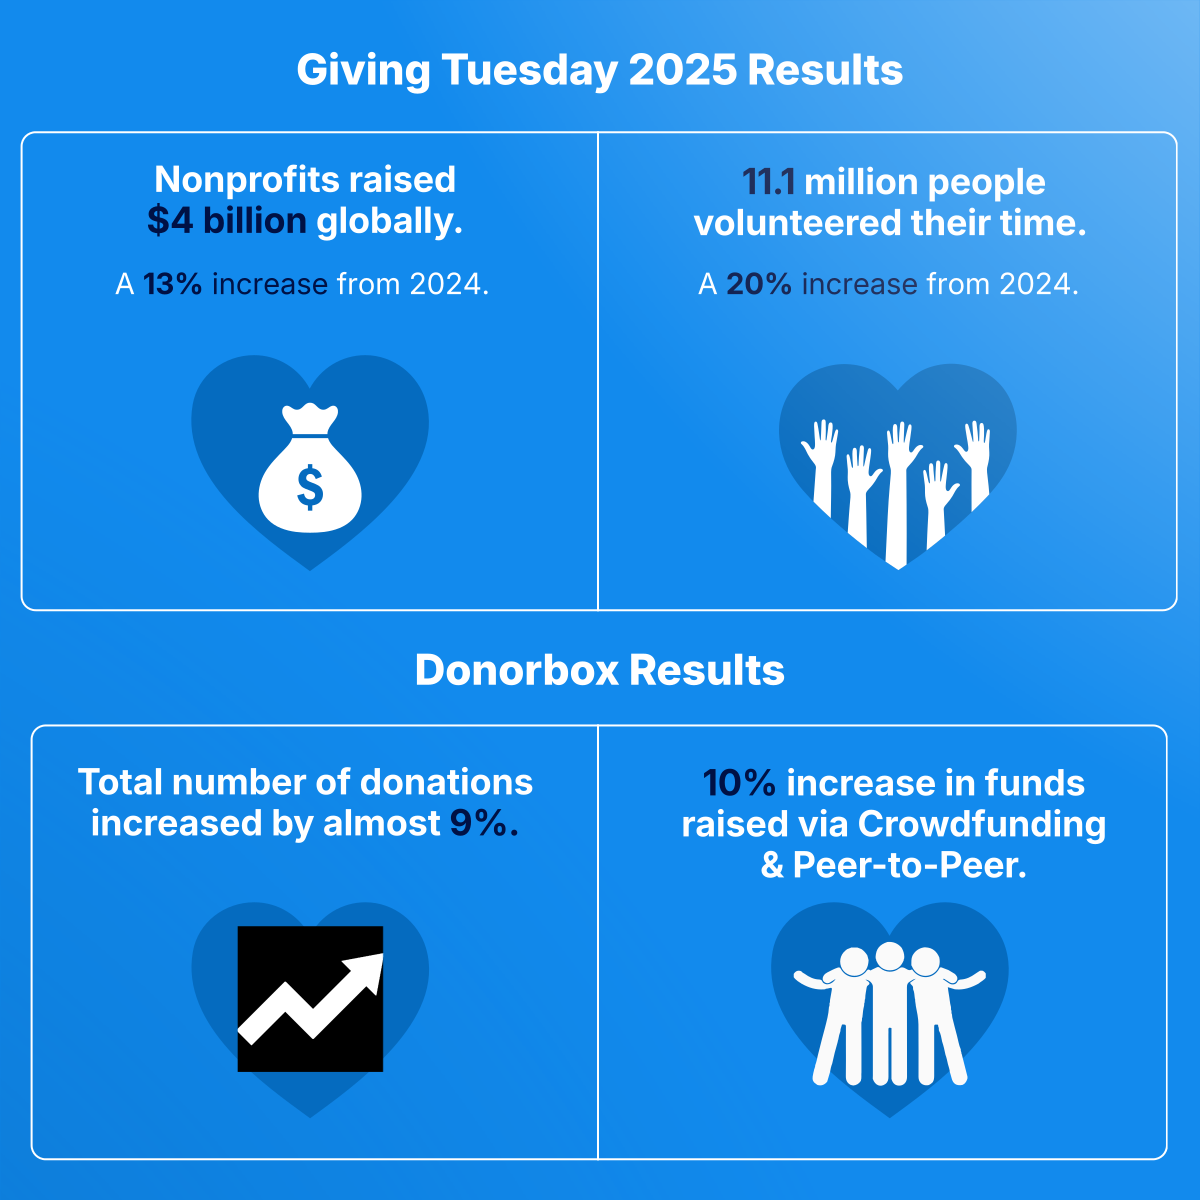
2. Nonprofits raised $4 billion on Giving Tuesday in 2025.
This whopping number was a 13% increase from 2024, showing that generosity is on the rise.
We saw this trend across our own Donorbox data, too, with the total number of donations increasing by 9%.
This could indicate a higher number of new donors entering the scene, or lapsed donors returning to give again.
What to do
If you’ve been running with the same Giving Tuesday appeal for years, now’s the time to revamp your approach.
There’s a lot of noise on Giving Tuesday. Focus your campaign on what makes you stand out – your unique approach to solving a problem, providing aid, or connecting with the community.
The data also shows us that volunteering and peer-to-peer fundraising increased in 2025. Lean into this, leveraging the most supportive in your network to connect with new, energetic donors. Launch a special volunteer opportunity or peer-to-peer campaign.
For inspiration, check out how seven different nonprofits brought in significant donations through seven very different campaigns in our Giving Tuesday Playbook.
Beyond Giving Tuesday, the total amount given during 2025 surpassed the $600 billion mark for the very first time, increasing by 5.7% from $592.5 billion in 2024. Both of these amounts have been adjusted for inflation, reflecting true growth year over year.
This stat comes from Giving USA’s 2026 annual report. Interestingly enough, the largest increase of any source of giving came from bequests, which rose by nearly 20%.
What to do
This growth is likely due to strong market performance over the last few years. While the market has had ups and downs in 2026, it’s likely that many wealthy donors will have incentives to donate assets like stock and cryptocurrency to avoid paying capital gains taxes.
In fact, the average stock gift size increased by 29% in 2025.
Set up systems for clear, easy giving of these assets. Donors are busy this time of year – give them a way to donate with as few steps as possible, like The Giving Block + Donorbox integration.
Educate your donors about the value of giving away these assets and how they help you achieve your mission. Download this free resource for talking points:
4. Around 52% of nonprofits kick off their Giving Season campaign in October.
That’s right – more than half of all organizations start their Giving Season fundraising in October. And the inverse of this, of course, means that 48% of nonprofits don’t start in October.
In fact, 46.2% of nonprofits start their Giving Season asks in November.
It’s important to note here that just because nonprofits start their appeals in October or November doesn’t mean they’re receiving the majority of Giving Season donations during this time.
What to do
This tells us that waiting until December is not the norm, and likely isn’t the best practice.
While we don’t have data on whether starting this early significantly increases the amount or total of donations you receive, we can make an assumption here that earlier messaging builds mental capital with your audience – meaning they think of you when they’re ready to make their year-end gift.
In October, don’t lean too heavily on your appeal just yet. Instead, share impact stories and engaging content, especially videos. Create a regular cadence of social media posts, emails, and even direct mailing, if that’s part of your strategy. The goal here: get on donors’ radar.
This is also a good time to begin re-engaging lapsed donors. Starting early means you have time to rekindle that relationship before December 31st hits.
5. Monthly giving accounted for 27% of online revenue in 2025.
Nearly one in three online donations were monthly in 2025.
While this statistic isn’t specifically tied to Giving Season, if 37% of all online revenue came in during December, and 27% of all online revenue was monthly, then it’s safe to assume that a good amount of donations made in December were monthly.
What to do
Traditionally, we think of Giving Season as a time to capture generous one-time gifts. We want to capture the generosity of the season and encourage donors incentivized by tax benefits.
But your Giving Season campaign is also a great time to encourage ongoing support through monthly giving.
In your campaign materials, explain how upgrading to a monthly gift (often at a lower base amount than a one-time gift) adds up to more generosity over time. Someone might not be able to make a $240 one-time gift, but they may be able to swing a monthly $20 donation.
Make converting to monthly giving easier. Choose a fundraising platform with hearty infrastructure that includes an upgrade nudge for one-time donors, a self-service donor portal, and lots of customization, like Donorbox.
6. Most traffic to nonprofit websites came from mobile devices; however, users on desktop made 57% of all donations, accounting for 72% of revenue.
This one is interesting because it runs counter to what most of us would assume about the way our donors navigate our online materials.
The fact that most website visits (52% to be exact) come from mobile users isn’t surprising. But that just 48% of traffic, the desktop users, give 72% of revenue? That is huge.
What to do
This statistic tells me two things: that it’s important to optimize your donation form for both mobile and desktop experiences, and that some nonprofits aren’t optimizing their website for mobile conversions.
We can assume that some donors, especially in older generations, may feel more comfortable giving larger donations on a desktop. But that doesn’t mean we can’t also cater to mobile site visitors, who might be willing to give with the right conversion tactics.
Optimize your site for mobile browsing. Potential donors are landing on your site while they scroll on their phones, whether they’re following a link from social media or discovering you on an AI platform. Your site should look good on all mobile screens, with an adaptive, accessible design.
Next, optimize your site for mobile giving. That means adding a clear donate button (a button that sticks to the side of the screen is ideal), sharing clear calls to action, and using a donation form optimized for mobile giving. Your form should adapt seamlessly to different screen sizes, avoiding scrolling and cutoffs to build trust and ease of access.
7. 79% of nonprofits make PayPal available on their websites, compared to 58% for Google Pay, 57% for Apple Pay, and only 44% for Venmo.
Now, this stat isn’t about usage of payment methods. It’s about what nonprofits choose to make available on their website – which says a lot about our industry.
PayPal, the long-standing go-to for many nonprofits, may still reign supreme in terms of availability. But more and more, smart nonprofits are including other popular payment methods, like Google Pay and Apple Pay (which account for a combined 17% of all global online payments).
What to do
As you prep your Giving Season tools and campaigns, think about the incredible popularity of these online payment methods. Consumers in North America use digital wallets for 39% of all online purchases because they make payment quick, easy, and secure.
Choose a donation form that offers a wide variety of payment methods, like Donorbox’s OmniGive Donation Form. 25+ payment methods are available and display dynamically depending on your donors’ devices and physical locations.
Why Statistics Matter
There’s a reason why we love data like this, especially around Giving Season. It gives us insight into the state of fundraising and removes the feeling of flying blind.
If we know monthly giving is on the rise, for example, we can build out our strategy to serve donors who’d like to upgrade to recurring giving. Seeing the bird’s-eye view of how our sector is performing provides us with the tools we need for better strategies and smarter planning.
If you’re looking for a reliable partner to get you through the Giving Season and reach even your loftiest goals, Donorbox offers tools, resources, and world-class service. Join today and see how you can leverage Donorbox’s suite of fundraising tools for more Giving Season success.
Kristine Ensor is a freelance writer with over a decade of experience working with local and international nonprofits. As a nonprofit professional she has specialized in fundraising, marketing, event planning, volunteer management, and board development.

 Join the fundraising movement!